The sinking block benchmark#
This benchmark is based on the benchmark presented in Gerya [2010] and extended in Thieulot [2011]. It consists of a two-dimensional \(512~\text{ km}\times 512~\text{ km}\) domain filled with a fluid (the “mantle”) of density \(\rho_1=3200\text{ kg m}^{-3}\) and viscosity \(\eta_1=10^{21}~\text{ Pa s}\). A square block of size \(128~\text{ km}\times 128~\text{ km}\) is placed in the domain and is centered at location \((x_c,y_c)=(256~\text{ km},384~\text{ km})\) so as to ensure that its sides align with cell boundaries at all resolutions (GMR level \(\geq 3\)). It is filled with a fluid of density \(\rho_2=\rho_1+\delta \rho\) and viscosity \(\eta_2\). The gravity vector points downwards with \(|\boldsymbol{g}|=10~\text{ m s}^{-2}\). Boundary conditions are free slip on all sides. Only one time step is carried out and we measure the absolute velocity \(|v_z|\) in the middle of the block.
In a geodynamical context, the block could be interpreted as a detached slab or a plume head. As such its viscosity and density can vary (a cold slab has a higher effective viscosity than the surrounding mantle while it is the other way around for a plume head). The block densities can then vary from a few units to several hundreds of \(\text{ kg m}^{-3}\) and the viscosities by several orders of magnitude to represent a wide array of scenarios. The velocity field obtained for \(\eta_2=10^{27}~\text{ Pa s}\) and \(\delta\rho=32~\text{ kg m}^{-3}\) is shown in Fig. 175.
As shown in Thieulot [2011] one can independently vary \(\eta_1\), \(\rho_2\), \(\eta_2\), and measure \(|v_z|\) for each combination: the quantity \(|v_z| \eta_1/\delta\rho\) is then found to be a simple function of the ratio \(\eta^\star=\eta_1/\eta_2\): at high enough mesh resolution all data points collapse onto a single line. The shell script run_benchmark in the folder runs the experiment for values \(\eta_2\in [10^{17},10^{26}]~\text{ Pa s}\) and \(\delta\rho=8,32,128~\text{ kg m}^{-3}\). Results are shown in Fig. 176 and we indeed recover the expected trend with all data points forming a single smooth line.
Description of benchmark files
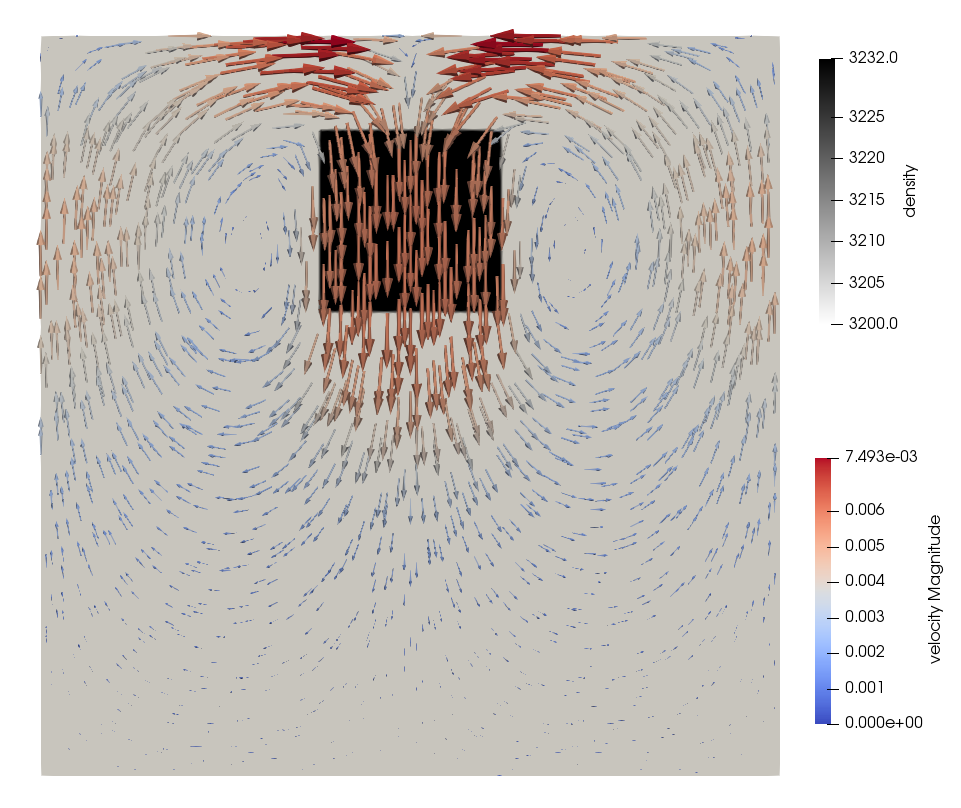
Fig. 175 Density field with velocity arrows for \(\eta_2=10^{27}~\text{ Pa s}\) and \(\delta\rho=32~\text{ kg m}^{-3}\)#

Fig. 176 Scaled velocity measurements as a function of the viscosity contrast between surrounding medium and block for all experiments.#