The Rayleigh-Taylor instability#
This section was contributed by Cedric Thieulot.
This benchmark is carried out in Deubelbeiss and Kaus [2008], Gerya [2010], Thieulot [2011]) and is based on the analytical solution by Ramberg [Ramberg, 1968], which consists of a gravitationally unstable two-layer system. Free slip are imposed on the sides while no-slip boundary conditions are imposed on the top and the bottom of the box. Fluid 1 \((\rho_1,\eta_1)\) of thickness \(h_1\) overlays fluid 2 \((\rho_2,\eta_2)\) of thickness \(h_2\) (with \(h_1+h_2=L_y\)). An initial sinusoidal disturbance of the interface between these layers is introduced and is characterised by an amplitude \(\Delta\) and a wavelength \(\lambda=L_x/2\) as shown in Fig. 166.
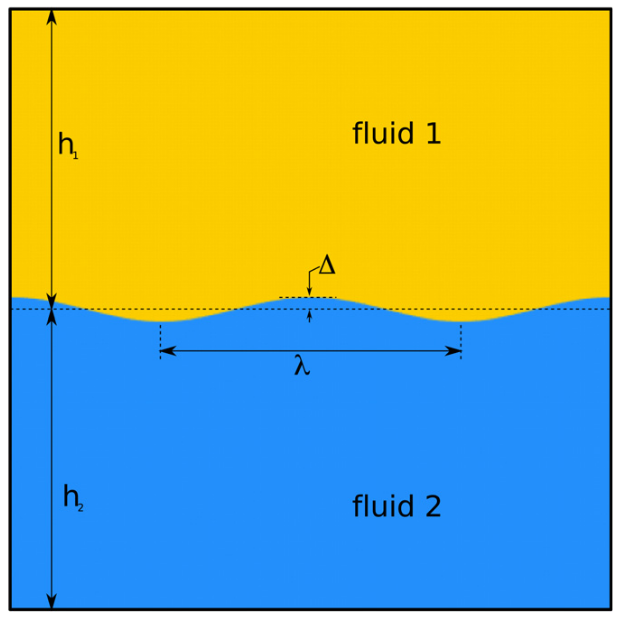
Fig. 166 Setup of the Rayleigh-Taylor instability benchmark (taken from Thieulot [2011])#
Under this condition, the velocity of the diapiric growth \(v_y\) is given by the relation
where \(K\) is the dimensionless growth factor and
We set \(L_x=L_y=\text{ 512 km}\), \(h_1=h_2=\text{ 256 km}\), \(|\boldsymbol{g}|=\text{10 m/s^2}\), \(\Delta=\text{3 km}\), \(\rho_1=\text{3300 kg/m^3}\), \(\rho_2=\text{3000 kg/m^3}\), \(\eta_1=\text{1e21 Pa.s}\). \(\eta_2\) is varied between \(10^{20}\) and \(10^{23}\) and 3 values of \(\lambda\) (64, 128, and 256km) are used. Adaptive mesh refinement based on density is used to capture the interface between the two fluids, as shown in Fig. 167 and Fig. 168. This translates as follows in the input file:
subsection Mesh refinement
  set Initial global refinement = 4
  set Initial adaptive refinement = 6
  set Strategy = density
  set Refinement fraction = 0.6
end
Description of benchmark files
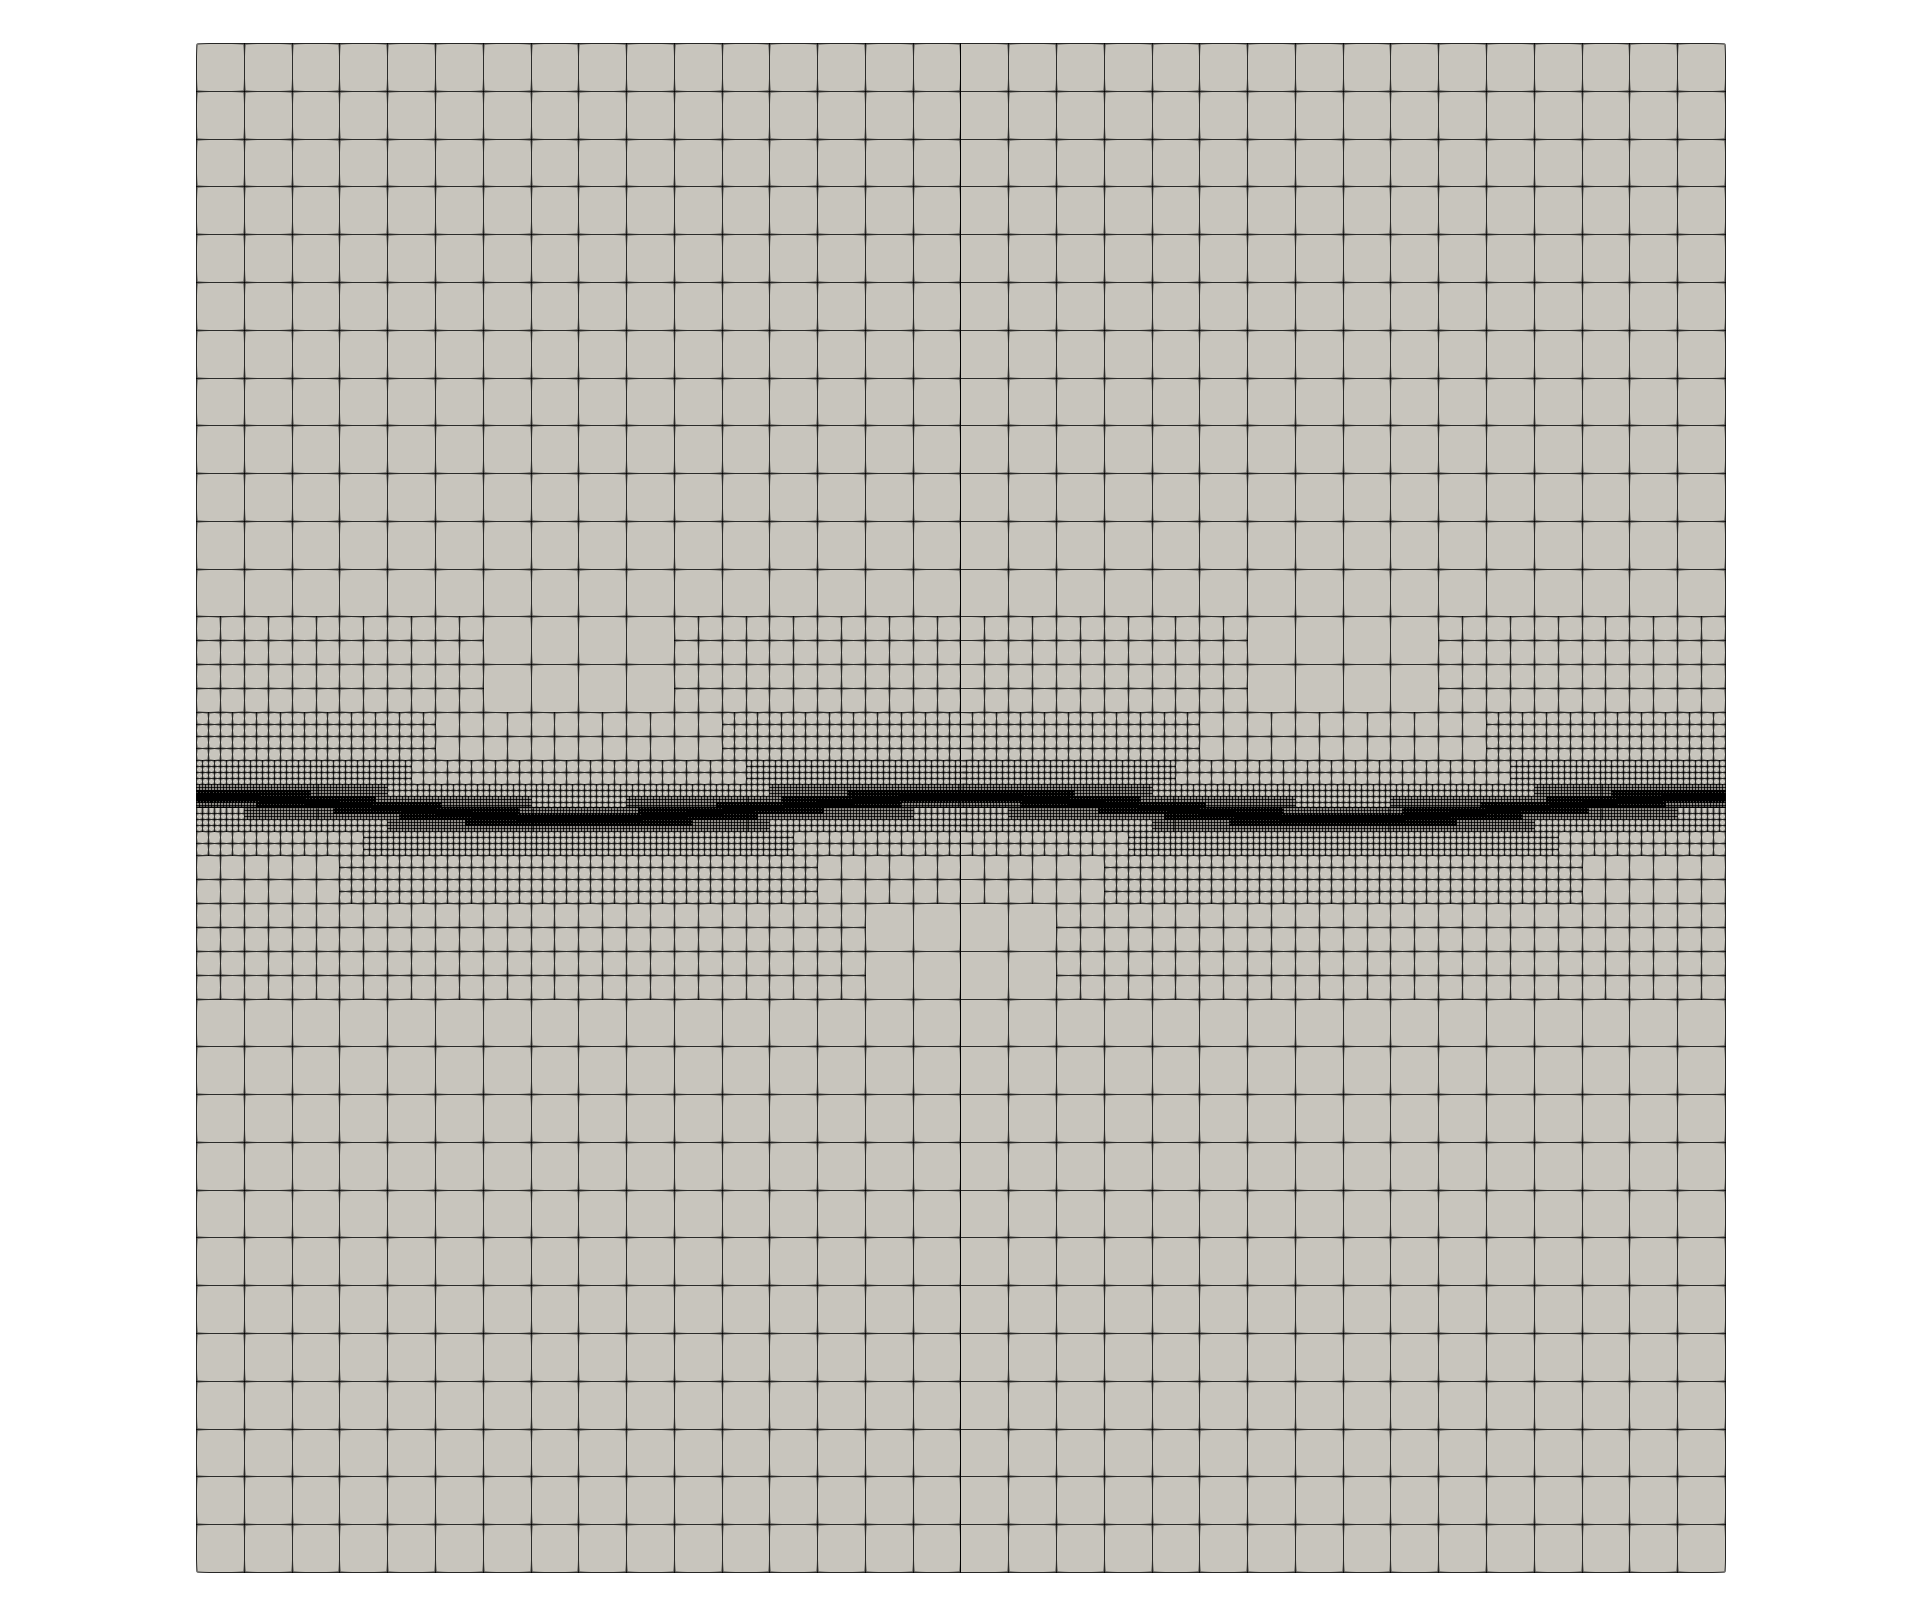
Fig. 167 Grid with initial global refinement 4 and adaptive refinement 6.#
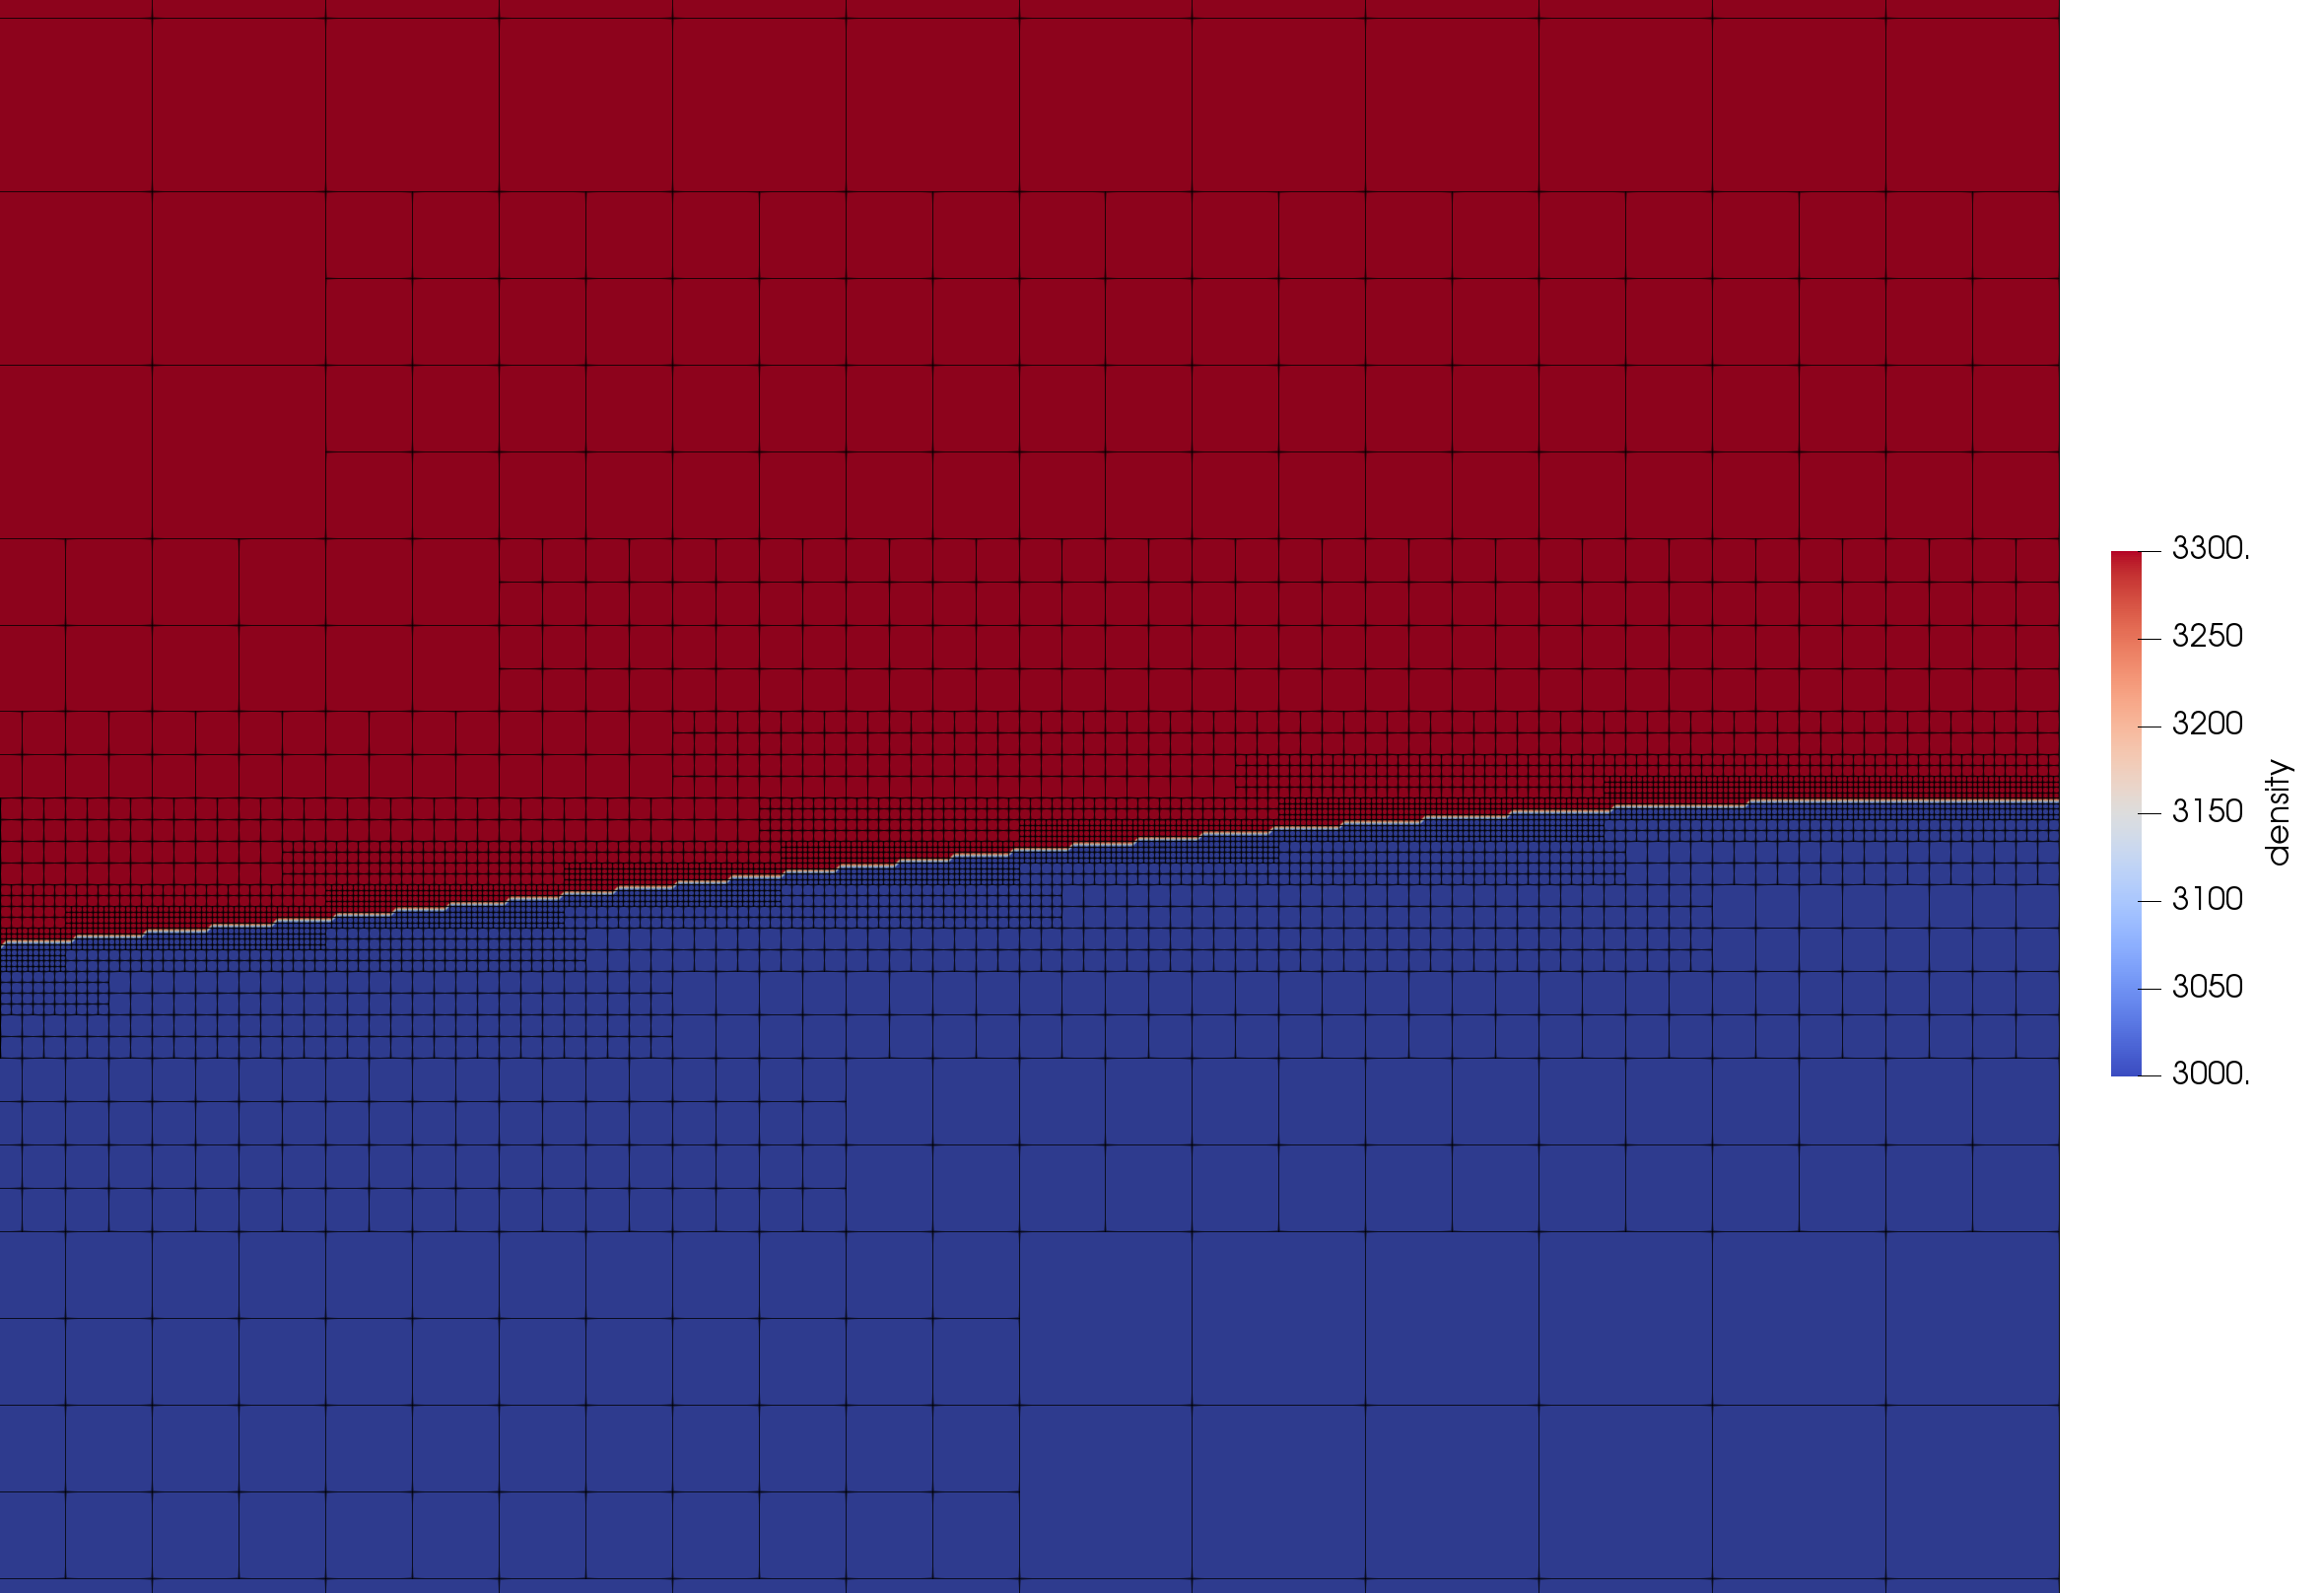
Fig. 168 Density field with detail of the mesh.#
The maximum vertical velocity is plotted against \(\phi_1\) in Fig. 169 and is found to match analytical results.
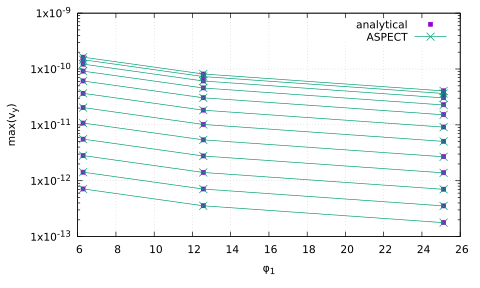
Fig. 169 Maximum velocity for three values of the \phi_1 parameter.#